1. Gather data from API 1 2 import requestsimport pandas as pd
Using the amazon price api from rapidapi.com
1 url = "https://amazon-price1.p.rapidapi.com/search"
Here, I am querying a bottom bracket used for replacing on my bicycle
1 2 3 4 5 6 7 8 9 10 querystring = {"keywords" :"bottom bracket" ,"marketplace" :"ES" } headers = { "X-RapidAPI-Key" : "hidden here" , "X-RapidAPI-Host" : "amazon-price1.p.rapidapi.com" } response = requests.request("GET" , url, headers=headers, params=querystring) print (response.text)
Store the result in panda format
1 df = pd.read_json(response.text)
ASIN
title
price
listPrice
imageUrl
detailPageURL
rating
totalReviews
subtitle
isPrimeEligible
0
B005L83TF4
SUN RACE BBS15 Bottom Bracket 68/127MM-STEEL E...
13,14 €
https://m.media-amazon.com/images/I/316upP-m6I...
https://www.amazon.es/dp/B005L83TF4
3.8
33
0
1
B006RM70JY
The Bottom Bracket (English Edition)
2,99 €
https://m.media-amazon.com/images/I/411tM3tvfN...
https://www.amazon.es/dp/B006RM70JY
4.5
2
0
2
B075GQJFL1
Bottom Bracket
0,99 €
https://m.media-amazon.com/images/I/71jDB9f3AK...
https://www.amazon.es/dp/B075GQJFL1
0
3
B075DW91K2
Bottom Bracket
0,99 €
https://m.media-amazon.com/images/I/71Tr4XpGvd...
https://www.amazon.es/dp/B075DW91K2
0
4
B09D8S31V7
Bottom Bracket Racket
1,29 €
https://m.media-amazon.com/images/I/41qG7oY5Ky...
https://www.amazon.es/dp/B09D8S31V7
0
5
B08K2WHFS2
Dandy in the Underworld
1,29 €
https://m.media-amazon.com/images/I/51UcKxQdUn...
https://www.amazon.es/dp/B08K2WHFS2
0
6
B08K2VYJFK
Dandy in the Underworld
1,29 €
https://m.media-amazon.com/images/I/51UcKxQdUn...
https://www.amazon.es/dp/B08K2VYJFK
0
7
B01J5083XQ
Solstice
0,99 €
https://m.media-amazon.com/images/I/51avvd1duQ...
https://www.amazon.es/dp/B01J5083XQ
0
8
B01J5082CS
Solstice
0,99 €
https://m.media-amazon.com/images/I/51avvd1duQ...
https://www.amazon.es/dp/B01J5082CS
0
9
B09J781T8V
Soporte Inferior, Bottom Bracket, Token Ninja ...
74,01 €
https://m.media-amazon.com/images/I/312Gc5vg36...
https://www.amazon.es/dp/B09J781T8V
5.0
1
0
2. Gather data from website 2.1 download from academic website Dr. Ni’s website contains a varitey of amazon products reviews / metadata avaialbe for research usage.
Download the metadata from electronics category
1 curl -O https://drive.google.com/file/d/1QKGvsVNDfHJORr_3atR69B06UuHFJzK9/view?usp=share_link
Citation Justifying recommendations using distantly-labeled reviews and fined-grained aspects
2.2 download from Kaggle 1 2 3 4 5 6 7 import osimport jsonimport pandas as pdimport numpy as npimport dataframe_image as dfiimport seaborn as snsimport matplotlib.pyplot as plt
Loading the data downloaded from kaggle
1 df = pd.read_csv('amazon_fine_food/Reviews.csv' )
Id
ProductId
UserId
ProfileName
HelpfulnessNumerator
HelpfulnessDenominator
Score
Time
Summary
Text
0
1
B001E4KFG0
A3SGXH7AUHU8GW
delmartian
1
1
5
1303862400
Good Quality Dog Food
I have bought several of the Vitality canned d...
1
2
B00813GRG4
A1D87F6ZCVE5NK
dll pa
0
0
1
1346976000
Not as Advertised
Product arrived labeled as Jumbo Salted Peanut...
2
3
B000LQOCH0
ABXLMWJIXXAIN
Natalia Corres "Natalia Corres"
1
1
4
1219017600
"Delight" says it all
This is a confection that has been around a fe...
3
4
B000UA0QIQ
A395BORC6FGVXV
Karl
3
3
2
1307923200
Cough Medicine
If you are looking for the secret ingredient i...
4
5
B006K2ZZ7K
A1UQRSCLF8GW1T
Michael D. Bigham "M. Wassir"
0
0
5
1350777600
Great taffy
Great taffy at a great price. There was a wid...
Export raw data as image
1 dfi.export(df.head(10 ), 'img/raw_data.png' )
3. Data cleaning and visualize 3.1 Clean irrelevant data column UserId, profileName, Timestamp is not related to product recommendation, so it’s better to remove them off
1 df = df.drop('UserId' , axis = 1 )
1 df = df.drop('ProfileName' , axis = 1 )
1 df = df.drop('Time' , axis = 1 )
Id
ProductId
HelpfulnessNumerator
HelpfulnessDenominator
Score
Summary
Text
0
1
B001E4KFG0
1
1
5
Good Quality Dog Food
I have bought several of the Vitality canned d...
1
2
B00813GRG4
0
0
1
Not as Advertised
Product arrived labeled as Jumbo Salted Peanut...
2
3
B000LQOCH0
1
1
4
"Delight" says it all
This is a confection that has been around a fe...
3
4
B000UA0QIQ
3
3
2
Cough Medicine
If you are looking for the secret ingredient i...
4
5
B006K2ZZ7K
0
0
5
Great taffy
Great taffy at a great price. There was a wid...
3.2 Inspect Duplicate Data 1 productId_c = df.iloc[:,1 :2 ]
ProductId
count
0
B001E4KFG0
0
1
B00813GRG4
0
2
B000LQOCH0
0
3
B000UA0QIQ
0
4
B006K2ZZ7K
0
1 productId_c.insert(1 , 'count' ,0 )
Group by prouduct id to count num of duplicated for each id
1 p_f = productId_c.groupby(['ProductId' ]).transform('count' )
1 p_f.sort_values(by=['count' ], ascending=False ).head(5 )
count
frequency
563881
913
913
563615
913
913
563629
913
913
563628
913
913
563627
913
913
count
frequency
0
1
30408
1
1
30408
2
1
30408
3
1
30408
4
4
17296
1 p_a = p_f.groupby(['count' ]).count()
Group by count got early to calculate frequency for each duplicate number
1 p_a['frequency' ] = p_f.groupby(['count' ]).transform('count' )
count
1 30408
2 24524
3 20547
4 17296
5 15525
...
564 5076
567 567
623 623
632 2528
913 913
Name: frequency, Length: 283, dtype: int64
Int64Index([ 1, 2, 3, 4, 5, 6, 7, 8, 9, 10,
...
491, 506, 530, 542, 556, 564, 567, 623, 632, 913],
dtype='int64', name='count', length=283)
frequency
count
1
30408
2
24524
3
20547
4
17296
5
15525
Build an image showing the num of duplcated product existed in data set, it’s tremendous
1 2 3 4 5 6 7 8 9 plt.bar(p_a.index, p_a.iloc[0 ]) plt.xlabel("duplicated count" ) plt.ylabel("num of products" ) plt.title("duplicated products ditribution" ) plt.savefig('img/duplicated_product_distribution.png' ) plt.show()
3.3 Merge Duplicated Data The main focus here is merging duplicated data, making each product id unique
For those product contains multiple scores, counting an average probably be a good choice for it. The drawback is some unique fields also need to be removed (‘Text’, ‘Summary’). Since the score plays a determined factor in recommendation, removing is necessary for certain analysis.
1 df_avg = df.iloc[:, 1 :5 ]
ProductId
HelpfulnessNumerator
HelpfulnessDenominator
Score
0
B001E4KFG0
1
1
5
1
B00813GRG4
0
0
1
2
B000LQOCH0
1
1
4
3
B000UA0QIQ
3
3
2
4
B006K2ZZ7K
0
0
5
...
...
...
...
...
568449
B001EO7N10
0
0
5
568450
B003S1WTCU
0
0
2
568451
B004I613EE
2
2
5
568452
B004I613EE
1
1
5
568453
B001LR2CU2
0
0
5
568454 rows × 4 columns
1 avg = df_avg.groupby(['ProductId' ]).mean()
1 avg.insert(0 , 'ProductId' , avg.index)
1 avg.index = range (len (avg.index))
Cleaned Data generated, duplicated value eliminated
ProductId
HelpfulnessNumerator
HelpfulnessDenominator
Score
0
0006641040
3.027027
3.378378
4.351351
1
141278509X
1.000000
1.000000
5.000000
2
2734888454
0.500000
0.500000
3.500000
3
2841233731
0.000000
0.000000
5.000000
4
7310172001
0.809249
1.219653
4.751445
...
...
...
...
...
74253
B009UOFTUI
0.000000
0.000000
1.000000
74254
B009UOFU20
0.000000
0.000000
1.000000
74255
B009UUS05I
0.000000
0.000000
5.000000
74256
B009WSNWC4
0.000000
0.000000
5.000000
74257
B009WVB40S
0.000000
0.000000
5.000000
74258 rows × 4 columns
1 avg['HelpfulRatio' ] = avg['HelpfulnessNumerator' ] / avg['HelpfulnessDenominator' ]
Replace NAN value with 0
1 avg["HelpfulRatio" ] = avg["HelpfulRatio" ].replace(np.nan, 0 )
ProductId
HelpfulnessNumerator
HelpfulnessDenominator
Score
HelpfulRatio
0
0006641040
3.027027
3.378378
4.351351
0.896000
1
141278509X
1.000000
1.000000
5.000000
1.000000
2
2734888454
0.500000
0.500000
3.500000
1.000000
3
2841233731
0.000000
0.000000
5.000000
0.000000
4
7310172001
0.809249
1.219653
4.751445
0.663507
...
...
...
...
...
...
74253
B009UOFTUI
0.000000
0.000000
1.000000
0.000000
74254
B009UOFU20
0.000000
0.000000
1.000000
0.000000
74255
B009UUS05I
0.000000
0.000000
5.000000
0.000000
74256
B009WSNWC4
0.000000
0.000000
5.000000
0.000000
74257
B009WVB40S
0.000000
0.000000
5.000000
0.000000
74258 rows × 5 columns
1 dfi.export(avg.head(10 ), 'img/clean_data.png' )
objc[5257]: Class WebSwapCGLLayer is implemented in both /System/Library/Frameworks/WebKit.framework/Versions/A/Frameworks/WebCore.framework/Versions/A/Frameworks/libANGLE-shared.dylib (0x7ffb59f48ec8) and /Applications/Google Chrome.app/Contents/Frameworks/Google Chrome Framework.framework/Versions/109.0.5414.119/Libraries/libGLESv2.dylib (0x111ded880). One of the two will be used. Which one is undefined.
[0206/204727.828076:INFO:headless_shell.cc(223)] 60469 bytes written to file /var/folders/0t/vj81lwzn36xcslx3y2f148t40000gn/T/tmp9j9u523o/temp.png
3.4 Outlier detection Part of visualization (outlier) code reference from: https://medium.com/swlh/identify-outliers-with-pandas-statsmodels-and-seaborn-2766103bf67c
Method 1: Detect outlier based on Histograms
1 ax = sns.distplot(avg.Score, hist=True , hist_kws={"edgecolor" : 'w' , "linewidth" : 3 }, kde_kws={"linewidth" : 3 })
/var/folders/0t/vj81lwzn36xcslx3y2f148t40000gn/T/ipykernel_3210/869401958.py:1: UserWarning:

`distplot` is a deprecated function and will be removed in seaborn v0.14.0.

Please adapt your code to use either `displot` (a figure-level function with
similar flexibility) or `histplot` (an axes-level function for histograms).

For a guide to updating your code to use the new functions, please see
https://gist.github.com/mwaskom/de44147ed2974457ad6372750bbe5751

  ax = sns.distplot(avg.Score, hist=True, hist_kws={"edgecolor": 'w', "linewidth": 3}, kde_kws={"linewidth": 3})
1 ax.figure.savefig('img/dist_plot.png' )
Method 2: Detect outlier based on Distribution
1 ax = sns.boxplot(avg.Score)
1 ax.set (title='Review score box plot' )
[Text(0.5, 1.0, 'Review score box plot')]
1 ax.figure.savefig('img/box_plot_score.png' )
Based on graph results above, score below 2.0 can be possible outlier, however as it’s shown from second graph, the dot is super dense for those “possible outliers”, in this case, no need to remove outlier at this point.
3.5 Other visualization 1 fig = sns.relplot(data = avg, x = 'HelpfulnessDenominator' , y = 'HelpfulnessNumerator' ).set (title='Helpfulness ration among review' )
1 fig.savefig('img/relation_plot.png' )
ProductId
HelpfulnessNumerator
HelpfulnessDenominator
Score
HelpfulRatio
0
0006641040
3.027027
3.378378
4
0.896000
1
141278509X
1.000000
1.000000
5
1.000000
2
2734888454
0.500000
0.500000
3
1.000000
3
2841233731
0.000000
0.000000
5
0.000000
4
7310172001
0.809249
1.219653
4
0.663507
1 fig = sns.residplot(x='HelpfulnessNumerator' , y='HelpfulnessDenominator' , data=avg, scatter_kws=dict (s=50 ))
1 fig.figure.savefig('img/residual_plot.png' )
1 ax = plt.scatter(x= avg.index, y=avg['HelpfulRatio' ], color = 'g' , s= 0.5 )
Based on distribution graph, majority of Helpful review ratio concentrate between (0.6, 1)
1 ax.title='Review score box plot'
1 ax.figure.savefig('img/Helpful_Ratio_distribution.png' )
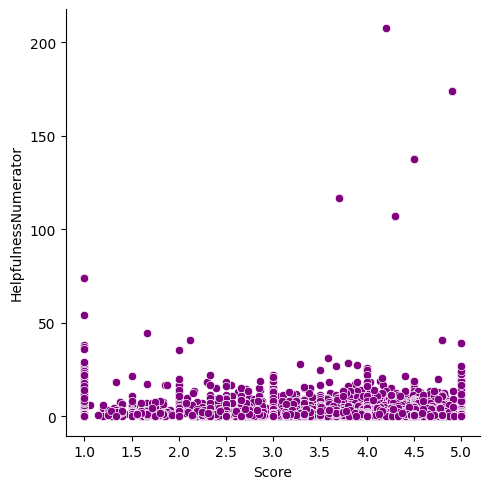
Here comes the graph shows the Helpfulness numberator and Score realtion, generally, most of review get average helpfulness count regardless of score
1 sns.relplot(data = avg, x = 'Score' , y = 'HelpfulnessNumerator' , color = 'purple' )
<seaborn.axisgrid.FacetGrid at 0x7f7b6b9c9960>
1 avg_int['Score' ] = avg['Score' ].astype(int )
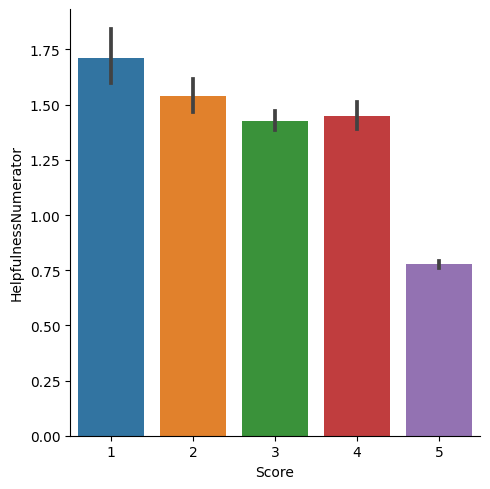
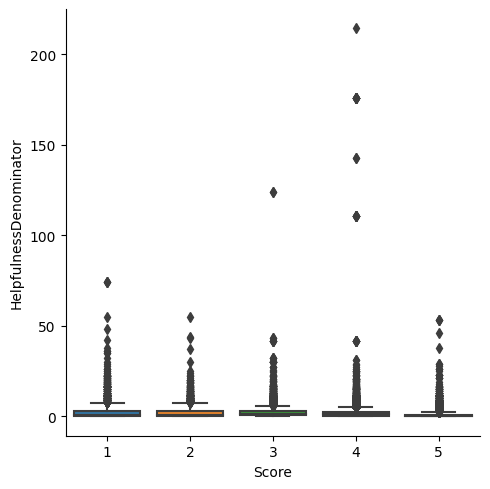
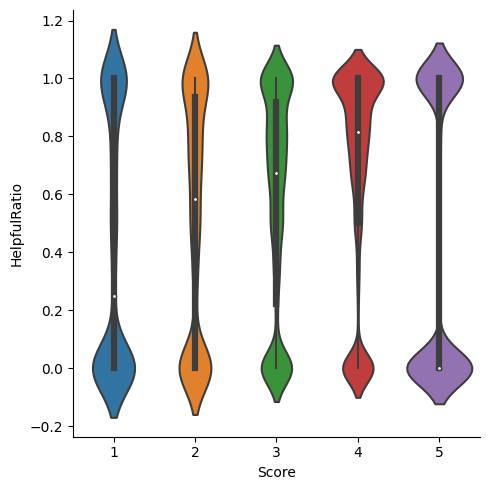
make review score five category, plot distribution of differenct helpfulness indictaors in next 3 graphs
1 sns.catplot(data = avg_int, x = 'Score' , y= 'HelpfulnessNumerator' , kind = 'bar' )
<seaborn.axisgrid.FacetGrid at 0x7f7ad889e200>
1 sns.catplot(data = avg_int, x = 'Score' , y = 'HelpfulnessDenominator' , kind = 'box' )
<seaborn.axisgrid.FacetGrid at 0x7f7bbd0bd150>
1 sns.catplot(data = avg_int, x = 'Score' , y = 'HelpfulRatio' , kind = 'violin' )
<seaborn.axisgrid.FacetGrid at 0x7f7babee9690>
Raw Data VS Clean Data Raw Data
Id
ProductId
UserId
ProfileName
HelpfulnessNumerator
HelpfulnessDenominator
Score
Time
Summary
Text
0
1
B001E4KFG0
A3SGXH7AUHU8GW
delmartian
1
1
5
1303862400
Good Quality Dog Food
I have bought several of the Vitality canned d...
1
2
B00813GRG4
A1D87F6ZCVE5NK
dll pa
0
0
1
1346976000
Not as Advertised
Product arrived labeled as Jumbo Salted Peanut...
2
3
B000LQOCH0
ABXLMWJIXXAIN
Natalia Corres "Natalia Corres"
1
1
4
1219017600
"Delight" says it all
This is a confection that has been around a fe...
3
4
B000UA0QIQ
A395BORC6FGVXV
Karl
3
3
2
1307923200
Cough Medicine
If you are looking for the secret ingredient i...
4
5
B006K2ZZ7K
A1UQRSCLF8GW1T
Michael D. Bigham "M. Wassir"
0
0
5
1350777600
Great taffy
Great taffy at a great price. There was a wid...
Clean Data (Manily For quantify analysis purpose)
ProductId
HelpfulnessNumerator
HelpfulnessDenominator
Score
HelpfulRatio
0
0006641040
3.027027
3.378378
4
0.896000
1
141278509X
1.000000
1.000000
5
1.000000
2
2734888454
0.500000
0.500000
3
1.000000
3
2841233731
0.000000
0.000000
5
0.000000
4
7310172001
0.809249
1.219653
4
0.663507
5
7310172101
0.809249
1.219653
4
0.663507
6
7800648702
0.000000
0.000000
4
0.000000
7
9376674501
0.000000
0.000000
5
0.000000
8
B00002N8SM
0.473684
0.868421
1
0.545455
9
B00002NCJC
0.000000
0.000000
4
0.000000


